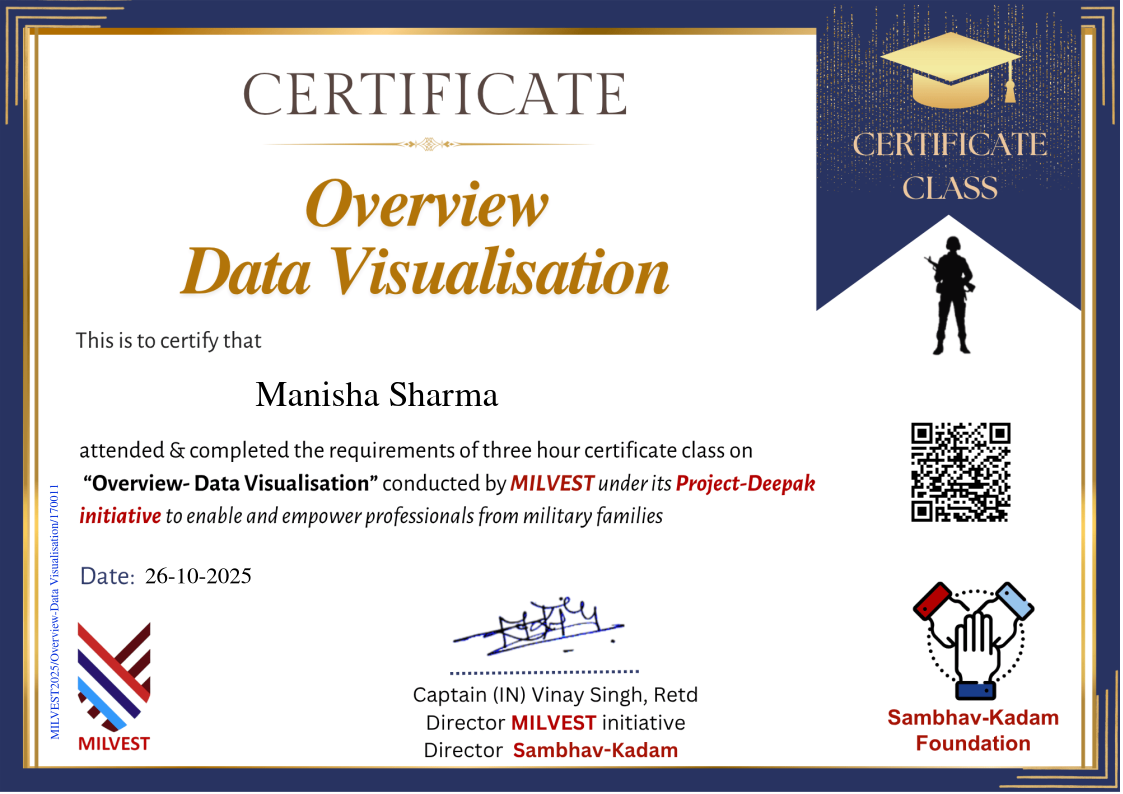

Manisha Sharma
View all Credentials

This Overview-Class introduced participants to the principles and practice of data visualization as a critical step in transforming data into insight. It covered the importance of visualization, the tools and techniques that make data understandable and actionable, such as Power BI and Tableau. and hands-on exposure to creating data dashboards on Power BI . The course also included an introduction to automation in Excel, enabling efficient creation of dynamic, data-driven dashboards for informed decision-making.
A showcase of the key skills and technologies learned and applied.
1. Class Attendance and Participation
2. Hands-on dashboard creation on PowerBI and Excel
3. Undertaking Assessment Quiz with 60% qualifying marks
Showcase your achievement with the world.